
Optimizing Conversion Rate
is Not As Simple As it Seems
Problem: $10,000 total budget, how do we optimize spend to maximize top line sales revenue performance?
A/b Test: $5000 spent on Mobile traffic vs $5,000 spent on desktop traffic
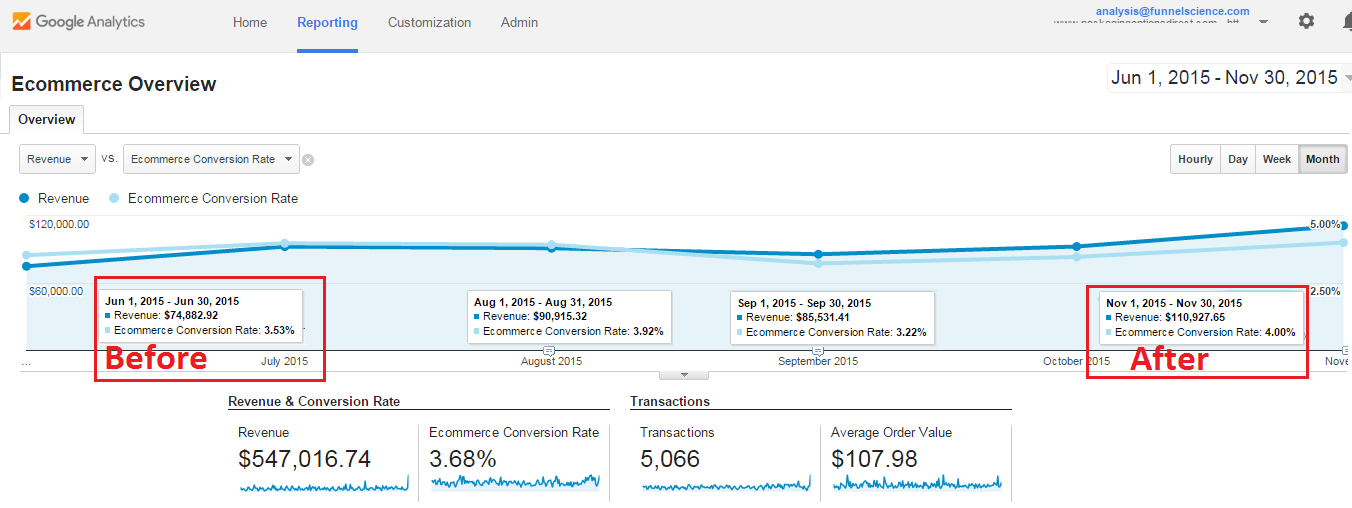
Context: At the end of July 2015, Funnel Science analyzed Packaging Options Direct Google marketing campaign and made a hypothesis regarding revenue performance based on visitor device type. In Google Adwords, we found X Conversion Rate and Y CPC for desktop traffic vs X Conversion Rate and Y CPC for mobile. In Google Analytics, we could link direct revenue to the marketing campaigns but there is also “assisted conversions” that influence the total amount of sales per month. As Adwords revenue increased, so did Total revenue.
A/B Testing Mobile vs Desktop Traffic
Based on the reports, a spilt test was setup to designed to keep the advertising budget the same, but to increase sales with a goal of $100,000 a month. To do this, we tested which traffic source based on the visitors device (tablet, desktop, mobile phone) would result in the highest conversion rate and average order value.
Since the cost per click changed between the two, we also had to factor in the amount of visitors gained from mobile at the lower CPC vs Desktop at the higher CPC.
The first test was designed to increase traffic of desktop visitors and turned off mobile traffic. In August, the first week had increase in performance but then there was 4 consecutive weeks of decreasing total revenue.
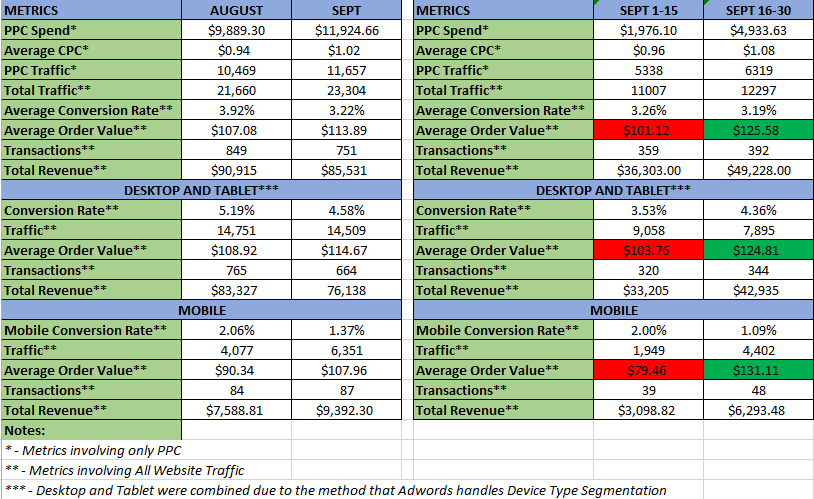
At the end of August, that portion of the experiment ended and we then decreased desktop traffic and increased mobile visitors. In doing so we found these KPI’s:
In September, we changed the experiment to compare the 1st – 15th to 16th – 30th and impact of changing mobile traffic priority over desktop. To reach our goal, we understood there are at least 5 linear equations that impacted Packing Options Direct monthly sales.
To solve for this real world challenge, we started by comparing the performance of desktop to mobile. Now, we can further analyze by increasing our variables by drilling down into the micro level of individual campaigns segments. Although the average Conversion Rate for the company is 13%, the campaign micro level fluctuates from 5.26% on the low side to 60.33% on the high. Campaign average order values also fluctuate, we think by running a baseline at the account level and comparing to each individual campaign, we can find further ways to improve performance.
One of our significant findings was by increasing traffic to the site, it resulted in overall decrease in conversion rate. However, the decrease in Conversion rate did not decrease revenue. Revenue increased as the conversion rate decreased.
Further Analysis: we now should try to understand and solve how increasing mobile traffic resulted in an increase desktop revenue despite total desktop traffic decreasing.
Equations used to solve:
1) Total budget / Avg CPC = traffic.
2) Mobile Traffic vs Desktop Traffic to Conversion Rate
3) Mobile Traffic vs desktop traffic to Average Order Value
4) Mobile Traffic vs desktop traffic average CPC
5) Increase Traffic = Increase Adwords Revenue + Increase in Total revenue.
6) Cheaper CPC traffic results in more visitors at X Conversion Rate / Y Order Value = ? increase in value or the alternative traffic source.
7) Traffic*Conversion Rate is the total number of sales Multiplied by the Average Order value = Revenue
Metrics: Budget, Total Traffic, Average Conversion Rate, Average Order Value, Transactions, Total Revenue.
KPI’S:
Definitions:
CPC – Cost per click
PPC Traffic – total number of website visitors attributed to Online Advertising
Total Traffic – total number of website visitors
Transactions – Total number of sales
Conversion Rate – % of people who made a ecommerce purchase
Mobile – customers who visited the website via a mobile device
Desktop – customers who visited the website via a desktop/laptop (computer)
Tablet – customers who visited the website via a tablet device
Note:
While PPC was not the sole cause of Conversions, on a Monthly Basis it was involved an average of 76% of Conversions which lead to an average of 51% of Total Revenue.
